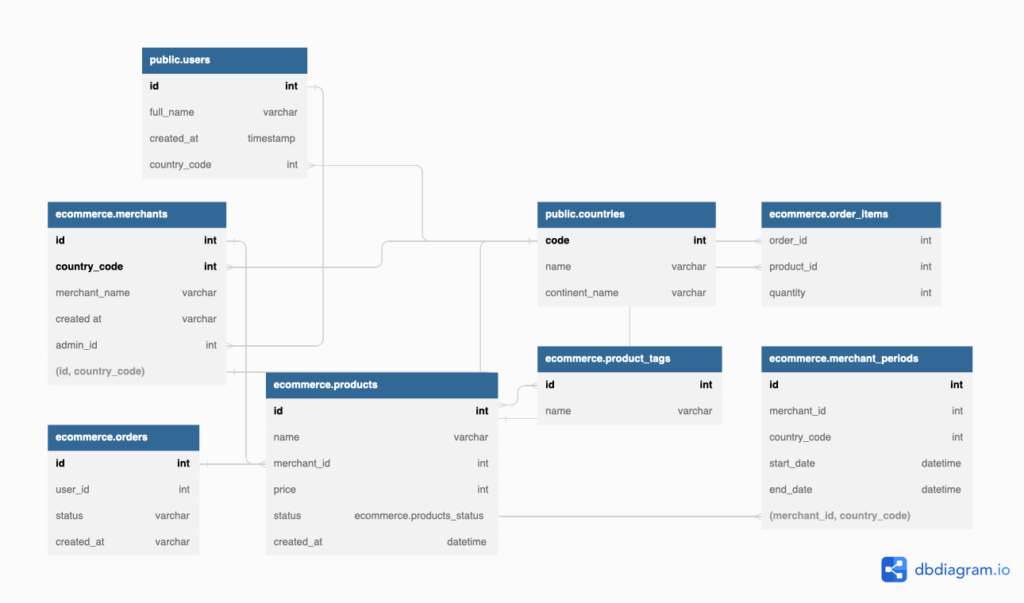
과거에는 ERD 를 그리기 위해서는 유료 툴을 사용해야 하는 문제가 있었지만
요즘에는 무료 툴이 많이 나와 편리하게 사용할 수 있다.
그 중에서도 필자가 자주 사용하는 dbdiagram.io 를 이번에 소개해보려 한다.
dbdiagram.io 는 간단한 코드를 작성하면, 그에 맞는 다이어그램을 작성 해준다.
코드가 매우 쉬워, SQL 을 간단하게라도 공부해본 사람이라면 바로 직관적으로 파악할 수 있다.
아래는 예제 코드이다.
1 2 3 4 5 6 7 8 9 10 11 12 13 14 15 16 17 18 19 20 21 22 23 24 25 26 27 28 29 30 31 32 33 34 35 36 37 38 39 40 41 42 43 44 45 46 47 48 49 50 51 52 53 54 55 56 57 58 59 60 61 62 63 64 65 66 67 68 69 70 71 72 73 74 75 76 77 78 79 80 81 82 83 84 85 86 87 88 89 90 91 92 93 94 95 96 97 98 99 100 101 102 | //// — LEVEL 1 //// — Schemas, Tables and References // Creating tables // You can define the tables with full schema names Table ecommerce.merchants { id int country_code int merchant_name varchar “created at” varchar admin_id int [ref: > U.id] Indexes { (id, country_code) [pk] } } // If schema name is omitted, it will default to “public” schema. Table users as U { id int [pk, increment] // auto–increment full_name varchar created_at timestamp country_code int } Table countries { code int [pk] name varchar continent_name varchar } // Creating references // You can also define relaionship separately // > many–to–one; < one–to–many; – one–to–one; <> many–to–many Ref: U.country_code > countries.code Ref: ecommerce.merchants.country_code > countries.code //———————————————-// //// — LEVEL 2 //// — Adding column settings Table ecommerce.order_items { order_id int [ref: > ecommerce.orders.id] // inline relationship (many–to–one) product_id int quantity int [default: 1] // default value } Ref: ecommerce.order_items.product_id > ecommerce.products.id Table ecommerce.orders { id int [pk] // primary key user_id int [not null, unique] status varchar created_at varchar [note: ‘When order created’] // add column note } //———————————————-// //// — Level 3 //// — Enum, Indexes // Enum for ‘products’ table below Enum ecommerce.products_status { out_of_stock in_stock running_low [note: ‘less than 20’] // add column note } // Indexes: You can define a single or multi–column index Table ecommerce.products { id int [pk] name varchar merchant_id int [not null] price int status ecommerce.products_status created_at datetime [default: `now()`] Indexes { (merchant_id, status) [name:‘product_status’] id [unique] } } Table ecommerce.product_tags { id int [pk] name varchar } Table ecommerce.merchant_periods { id int [pk] merchant_id int country_code int start_date datetime end_date datetime } Ref: ecommerce.products.merchant_id > ecommerce.merchants.id // many–to–one Ref: ecommerce.product_tags.id <> ecommerce.products.id // many–to–many //composite foreign key Ref: ecommerce.merchant_periods.(merchant_id, country_code) > ecommerce.merchants.(id, country_code) | cs |
위 코드를 입력 하게 되면,
아래와 같은 다이어그램을 자동으로 생성 해준다.

UI 가 매우 깔끔하여 보기도 편하고, 이해하기도 쉬운 편이다.
인덱스 지정, Enum 지정, 테이블, 컬럼, 1:1, 1:N, N:M 관계 등을 설정할 수 있다.
하지만 private, 버전 관리 등의 기능을 사용하기 위해서는 추가적으로 결제를 해야한다는 단점이 있다.

